


 matt@aihealthician.co.uk


TL;DR:
- Measuring disease risk markers provides early biological insights, enabling proactive prevention before symptoms arise. Tracking these markers over time reveals long-term patterns and trends that inform personalized health strategies. Consistent, longitudinal data enhances predictive accuracy and supports targeted interventions, leading to lasting health benefits.
Most people assume that measuring disease risk markers is something you do when something has already gone wrong. That assumption is exactly backwards. Understanding why measure disease risk markers is not about inviting anxiety into your life. It is about gaining the kind of biological intelligence that lets you act before a problem becomes a diagnosis. When you know your markers, you stop guessing and start making decisions grounded in your own physiology. This article covers what risk markers actually tell you, which ones carry the most predictive weight, and how to turn that data into a prevention strategy that works for you specifically.
Table of Contents
- What are disease risk markers and why do they matter
- How measuring cardiovascular risk markers predicts long-term health
- Understanding inflammatory markers and cancer risk stratification
- The challenges and nuances of interpreting disease risk markers
- How to use disease risk marker measurements to personalise your health strategy
- The overlooked advantage of cumulative risk tracking for lasting health benefits
- Personalised health testing and support with AI Healthician
- Frequently asked questions
Key Takeaways
| Point | Details |
|---|---|
| Definition of risk markers | Disease risk markers are measurable biological indicators that reveal your likelihood of developing specific illnesses before symptoms appear. |
| Predictive power of cumulative data | Tracking multiple disease risk markers over time offers more accurate predictions than single measurements. |
| Importance of repeated testing | Repeating tests like hs-CRP ensures results reflect chronic risk rather than temporary conditions like infection. |
| Personalised prevention benefits | Measuring your risk markers enables tailored lifestyle, screening, and medical interventions to reduce disease risk. |
| Value of professional guidance | Interpreting risk markers together with health experts helps create effective, personalised prevention strategies. |
What are disease risk markers and why do they matter
Disease risk markers, more formally called biomarkers, are measurable biological indicators found in blood, tissue, urine, or genetic material that reflect what is happening inside your body at a physiological level. They are not diagnoses. They are signals. Some indicate current function, others reveal genetic predispositions, and some track how your body is responding to stress, inflammation, or metabolic load over time.
The most clinically significant category for prevention is susceptibility markers. These are indicators that show elevated disease risk before any symptoms appear. The BRCA1/2 gene mutations are a well-known example, carrying a 45 to 65% lifetime breast cancer risk in carriers, compared to roughly 12% in the general population. That is not a diagnosis. It is a window of opportunity to act.
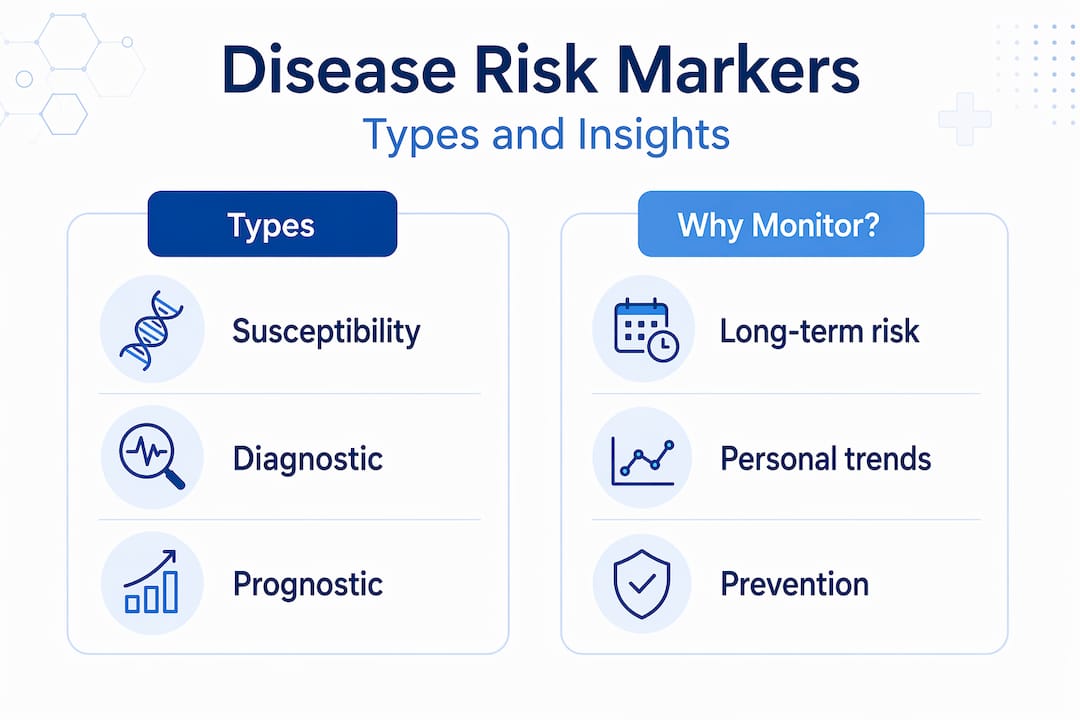
The importance of disease markers goes well beyond genetics. Biochemical markers such as fasting glucose, LDL particle size, and inflammatory proteins give you a running account of how your daily habits are shaping your long-term risk. Tracking disease risk over time transforms these individual readings into a coherent picture of where you are headed.
Key categories of disease risk markers include:
- Genetic susceptibility markers: Variants in genes like BRCA1/2, APOE, and MTHFR that signal inherited risk
- Biochemical markers: Blood-based indicators such as HbA1c, lipid panels, and liver enzymes
- Inflammatory markers: Proteins like hs-CRP and IL-6 that reflect systemic inflammation
- Hormonal markers: Cortisol, insulin, and sex hormones that influence metabolic and cardiovascular risk
- Imaging and functional markers: Blood pressure, arterial stiffness, and body composition data
How measuring cardiovascular risk markers predicts long-term health
Cardiovascular disease does not appear overnight. It builds across decades, shaped by the cumulative effect of your metabolic, inflammatory, and lifestyle markers. This is precisely why a single cholesterol reading taken at age 45 tells you far less than a pattern of readings tracked from your twenties onwards.
The Life’s Essential 8 framework, developed by the American Heart Association, scores cardiovascular health across eight components: diet, physical activity, nicotine exposure, sleep, body mass index, blood lipids, blood glucose, and blood pressure. Research from the Framingham Heart Study published in 2026 found that higher cumulative scores from early adulthood were linked to a 73% lower CVD risk over 25 years. That figure should reframe how you think about when to start measuring.
Here is a practical approach to monitoring your cardiovascular markers effectively:
- Establish a baseline early. Get a full lipid panel, fasting glucose, blood pressure, and hs-CRP measured in your twenties or thirties, not just when your GP flags a concern.
- Test at consistent intervals. Annual or biannual testing allows you to identify trends rather than react to isolated readings.
- Score your lifestyle components. Use the Life’s Essential 8 framework as a self-audit alongside your blood results to contextualise what is driving any changes.
- Act on modifiable markers first. Blood pressure, LDL, and fasting glucose all respond meaningfully to targeted lifestyle intervention before medication becomes necessary.
- Integrate your data with a health risk profiling service to understand how your individual markers interact and what your composite risk profile looks like.
Pro Tip: A single cardiovascular marker reading is a photograph. A series of readings over years is a film. The trend is almost always more informative than any individual value, particularly for lipids and inflammatory markers.
| Measurement approach | Predictive accuracy | Clinical utility |
|---|---|---|
| Single time-point cholesterol | Moderate | Identifies current risk category |
| Single time-point hs-CRP | Moderate | Flags acute inflammation or elevated risk |
| Cumulative 25-year CVD score | High | Predicts lifetime disease burden |
| Repeated multi-marker tracking | Very high | Enables preventative health strategies and early intervention |
Understanding inflammatory markers and cancer risk stratification
Inflammation is not just a response to injury. Chronic low-grade inflammation, invisible to you on a day-to-day basis, is one of the most consistent drivers of cardiovascular disease, metabolic dysfunction, and several cancers. High-sensitivity C-reactive protein (hs-CRP) is the most widely used blood marker for measuring this. hs-CRP levels above 3 mg/L double cardiovascular event risk in intermediate-risk patients, according to CDC and AHA guidelines. The catch is that hs-CRP also rises temporarily in response to infections, minor injuries, or even intense exercise, which means a single elevated reading can mislead you badly.

For prostate cancer, PSA (prostate-specific antigen) offers a similarly nuanced picture. A baseline PSA below 1 ng/mL predicts a 3.3% 20-year prostate cancer risk, while a baseline above 3 ng/mL predicts 34.8%, according to a 2026 JAMA Network Open cohort study. This kind of stratification allows you to personalise your screening frequency rather than following a one-size-fits-all schedule.
| Marker | Low risk threshold | Elevated risk threshold | Action indicated |
|---|---|---|---|
| hs-CRP | Below 1 mg/L | Above 3 mg/L | Repeat test, lifestyle review, cardiac assessment |
| PSA | Below 1 ng/mL | Above 3 ng/mL | Risk-stratified screening, urology referral |
Key recommendations when tracking biomarkers for inflammation and cancer risk:
- Always repeat an elevated hs-CRP test after four weeks to confirm it is not transient
- Establish a PSA baseline in your forties if you have a family history of prostate cancer
- Combine PSA with free-to-total PSA ratio for better specificity in borderline cases
- Use hs-CRP alongside lipid panels rather than in isolation for cardiovascular risk assessment
- Work with a clinician experienced in analysing biomarkers to interpret results in the context of your full health picture
Pro Tip: If your hs-CRP comes back above 10 mg/L, do not immediately assume chronic inflammation. That level almost always reflects an acute infection or injury. Retest after the illness resolves before drawing any conclusions about your cardiovascular risk.
The challenges and nuances of interpreting disease risk markers
Measuring health risk factors is genuinely useful. But the benefits of risk assessment only materialise when results are interpreted correctly, and that is harder than most people expect. A marker can be analytically valid, meaning the laboratory measures it accurately, while still having low clinical utility in a given population.
The core problem is positive predictive value. In a population where a disease is rare, even a highly sensitive test will generate a significant proportion of false positives. Many biomarkers fail population screening precisely because of this, and the FDA-NIH BEST initiative has emphasised rigorous analytical and clinical validation as a prerequisite for any marker used in clinical decision-making.
“A biomarker’s analytical performance tells you how well the test measures what it claims to measure. Its clinical utility tells you whether acting on that measurement actually improves patient outcomes. Both must be established before a marker guides clinical decisions.” — FDA-NIH BEST Framework on Biomarker Validation
Common pitfalls and considerations when measuring disease risk markers:
- Context is everything. A single elevated result without clinical context can cause unnecessary anxiety or, worse, unnecessary intervention.
- Reference ranges are population averages. Your optimal value may differ from the standard normal range based on age, sex, ethnicity, and individual physiology.
- Analytical variability exists. Different laboratories use different assays, meaning results are not always directly comparable across testing sites.
- Correlation is not causation. A marker associated with disease risk does not necessarily cause the disease, and lowering it does not automatically reduce risk.
- Timing matters. Fasting status, recent exercise, illness, and even time of day can all affect results for certain markers.
Understanding why biomarker analysis matters is as important as understanding the markers themselves.
How to use disease risk marker measurements to personalise your health strategy
The real value of measuring risk markers is not the number on the page. It is what you do with it. Risk biomarkers enable proactive personalised prevention by identifying high-risk individuals before clinical disease develops, shifting care from reactive to preventive. That shift is where the meaningful health gains live.
Here is a stepwise framework for applying your results:
- Identify your priority markers. Based on your age, sex, family history, and current symptoms, determine which categories of risk markers are most relevant to you.
- Schedule baseline testing. Get a comprehensive panel done so you have a reference point. This should include metabolic, inflammatory, hormonal, and where relevant, genetic markers.
- Interpret results with professional support. Do not attempt to act on complex biomarker data alone. A clinician or specialist service can contextualise your results against your full health history.
- Personalise your interventions. Targeted dietary changes, exercise protocols, sleep optimisation, and stress management can all be calibrated to your specific marker profile rather than generic guidelines.
- Monitor changes at regular intervals. Retesting every six to twelve months allows you to see whether your interventions are working and adjust accordingly.
- Integrate genetic and biochemical data. Combining DNA-level risk information with current biochemical markers gives you both the inherited landscape and the real-time picture of how your environment and habits are shaping your biology.
Pro Tip: The goal is not to achieve perfect numbers. It is to understand your trajectory. A marker moving in the right direction after a targeted intervention is far more meaningful than a single result sitting inside a reference range.
Explore proactive health management and top biomarkers to monitor for a deeper look at building a personalised monitoring strategy.
The overlooked advantage of cumulative risk tracking for lasting health benefits
Most health-conscious individuals who invest in biomarker testing still make the same fundamental error: they treat each test as a standalone event. They get results, feel reassured or concerned, make a few changes, and then repeat the process months or years later without connecting the dots between measurements. This approach wastes most of the predictive value that biomarker testing can offer.
The evidence on this is unambiguous. Cumulative cardiovascular health burden from early adulthood greatly influences disease risk, far more than any single snapshot taken at a particular age. The Framingham data makes this concrete: the protective effect of sustained cardiovascular health across 25 years dwarfs what you can achieve by optimising markers in your fifties after decades of poor metabolic health.
“The trend across time is the signal. Any individual data point is just noise until it is placed in the context of what came before it and what is likely to follow.”
This reframing changes how you should approach data-driven health entirely. Instead of asking “are my markers normal today?” the more powerful question is “are my markers moving in the right direction over the past two years, and what does that trajectory predict for the next decade?”
Cumulative tracking also reveals something that single tests cannot: the compounding effect of small, sustained improvements. A modest reduction in hs-CRP maintained over three years has a meaningfully different cardiovascular impact than a large reduction held for three months. Trends reward consistency in a way that snapshots simply cannot capture.
Personalised health testing and support with AI Healthician
If this article has clarified the importance of disease markers for you, the logical next step is to actually measure yours with the depth and specificity that makes the data actionable.

AI Healthician offers a range of personalised testing services designed for individuals who want biological data they can genuinely act on. DNA health testing reveals your genetic susceptibility markers, giving you the inherited risk context that no blood test alone can provide. For metabolic precision, the metabolic test with 3D body scan maps your resting metabolic function alongside body composition data, while the active metabolic analysis shows how your physiology performs under real physiological demand. Together, these tests build the kind of comprehensive risk profile that supports targeted, measurable interventions rather than guesswork.
Frequently asked questions
What are disease risk markers and why should I measure them?
Disease risk markers are measurable biological indicators that reveal your likelihood of developing specific conditions, allowing you to take targeted preventive action before symptoms appear. Susceptibility biomarkers in particular identify elevated risk at the genetic or biochemical level, giving you the earliest possible window for intervention.
How do inflammatory markers like hs-CRP affect my cardiovascular risk assessment?
High-sensitivity C-reactive protein is a key indicator of systemic inflammation and cardiovascular risk, but elevated readings must always be confirmed with repeat testing to rule out temporary causes like infection. hs-CRP above 3 mg/L doubles cardiovascular event risk in intermediate-risk individuals, making it one of the more actionable markers in a standard panel.
Can PSA levels guide prostate cancer screening?
Yes, baseline PSA levels are a reliable tool for stratifying 20-year prostate cancer risk and personalising how frequently you should be screened. A baseline PSA below 1 ng/mL carries a 3.3% 20-year risk, while levels above 3 ng/mL carry a 34.8% risk, enabling a genuinely personalised screening schedule.
Are single biomarker tests reliable for predicting disease risk?
Single tests provide a useful starting point, but they capture only a moment in time and lack the predictive power of longitudinal tracking. Cumulative cardiovascular health burden predicts disease risk far more accurately than any individual snapshot, which is why consistent, repeated testing is the standard worth aiming for.
How can I use disease risk marker information for personalised health management?
By identifying your key risk markers through comprehensive testing, you can tailor your lifestyle, screening frequency, and preventive interventions to your specific biology rather than population averages. Risk biomarkers enable proactive prevention by identifying high-risk individuals before clinical disease develops, which is precisely the shift from reactive to preventive care that delivers the greatest long-term benefit.


