


 matt@aihealthician.co.uk


TL;DR:
- Monitoring biological signals like glucose, sleep, and HRV reveals the true drivers of energy fluctuations beyond subjective feelings. Continuous data tracking enables early detection of energy dips, improves recovery, and informs personalized interventions across multiple timescales. Using tailored protocols and advanced biofeedback techniques enhances metabolic health, mental clarity, and physical resilience for sustained performance.
Most people assume energy is simply a feeling. You wake up tired, you blame sleep. You crash at 3pm, you reach for coffee. But energy levels are biological signals, and understanding why monitor energy levels matters far beyond guesswork. They encode real-time information about your glucose metabolism, autonomic nervous system function, sleep architecture, and recovery capacity. When you start treating energy as data rather than sensation, everything changes. This article breaks down the physiology, the monitoring methods, and the personalised protocols that turn raw biological signals into actionable performance gains.
Table of Contents
- Why monitoring energy levels reveals what feelings cannot
- How continuous monitoring transforms energy management
- Comparing key energy indicators: glucose, sleep, activity, and HRV
- Personalising energy monitoring for better health and performance
- Enhancing energy monitoring with advanced biofeedback techniques
- A fresh perspective: why monitoring energy as a dynamic system is the future
- Enhance your energy journey with AI Healthician’s personalised testing solutions
- Frequently asked questions
Key Takeaways
| Point | Details |
|---|---|
| Energy signals vary widely | Energy levels come from multiple physiological signals including glucose, sleep, and heart rate variability that change over different timescales. |
| Continuous monitoring adds value | Ongoing data collection reveals patterns and trends that enable proactive, personalised adjustments for better energy. |
| Integrated approach works best | Combining glucose, sleep, physical activity, and HRV monitoring provides a complete picture of your energy system. |
| Personalisation is essential | Use detailed metrics like glucose time-in-range and sleep variability and test interventions over weeks for meaningful improvement. |
| Active biofeedback boosts mental energy | Heart rate variability biofeedback training enhances autonomic balance and improves emotional and physical energy when properly applied. |
Why monitoring energy levels reveals what feelings cannot
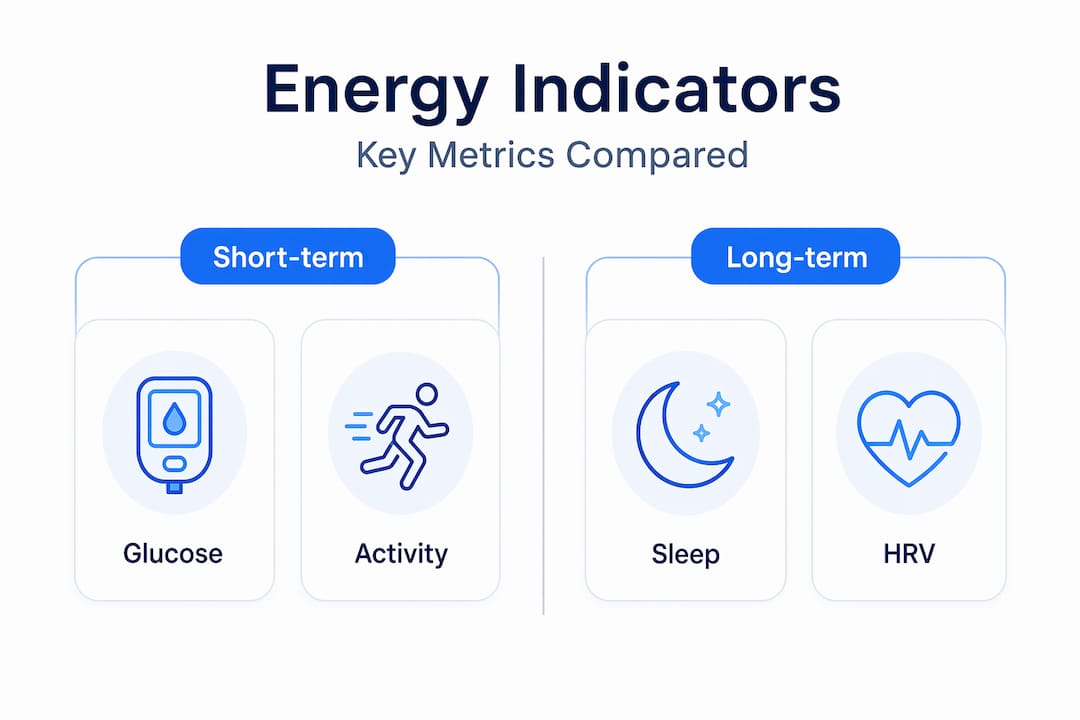
Energy is not a single variable. It is a composite output produced by dozens of interconnected systems operating on different timescales. Glucose fluctuations unfold over minutes. Sleep quality shifts night to night. Heart rate variability (HRV) reflects weeks of accumulated stress and recovery. Treating any one of these in isolation gives you a fragment of the picture.
The key physiological signals worth tracking include:
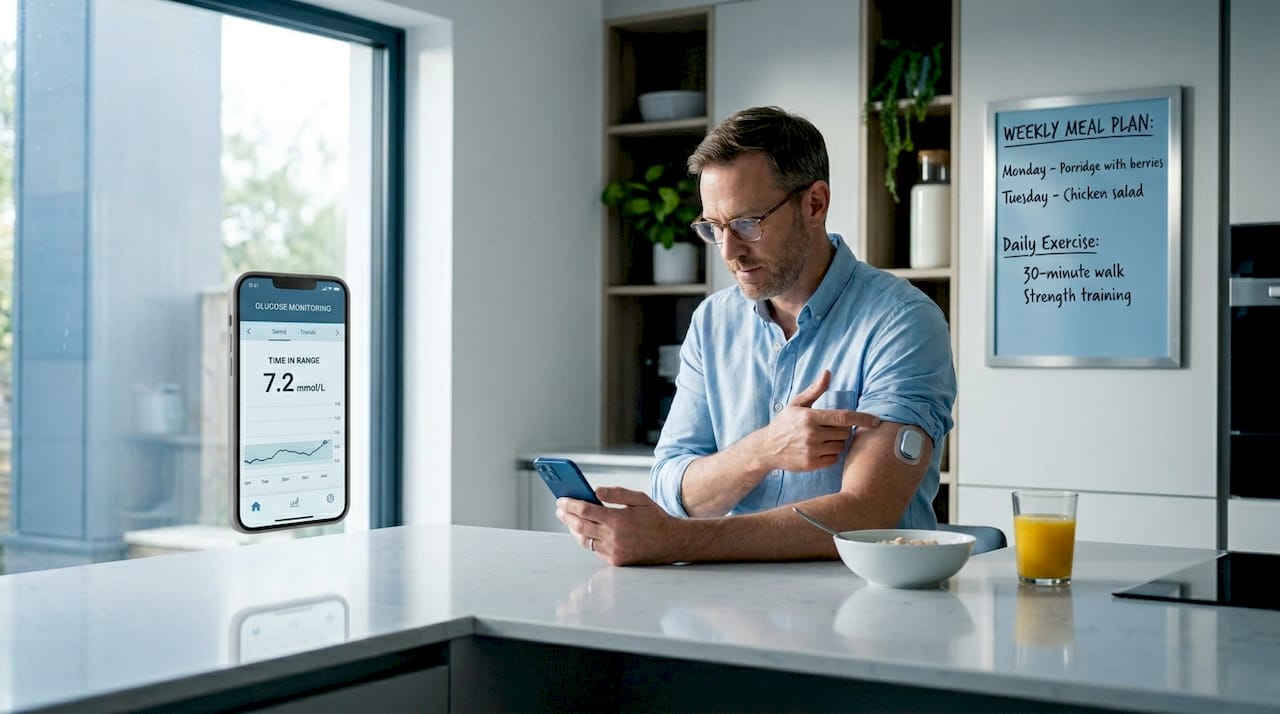
- Blood glucose patterns: Rapid rises and crashes in glucose directly drive mental fog, irritability, and physical fatigue. Continuous glucose monitoring (CGM) reveals these patterns in real time, far beyond what a standard fasting blood test captures.
- Sleep quality and variability: Total sleep hours matter far less than most people believe. Night-to-night variability in sleep efficiency, deep sleep duration, and REM distribution has a measurable impact on next-day cognitive function and physical readiness.
- Heart rate variability (HRV): HRV measures the variation in time between heartbeats and reflects the balance between your sympathetic and parasympathetic nervous systems. Low HRV correlates with poor recovery, elevated stress, and reduced mental energy.
CGM in particular has demonstrated benefits that extend well beyond glucose awareness. Patient-accessible CGM improved multiple cardiometabolic risk markers beyond HbA1c, showing that monitoring the physiology driving energy swings produces wider benefits than anyone anticipated. Understanding which top biomarkers signal peak performance is the essential starting point before layering in interventions.
The importance of energy monitoring lies precisely here. Without objective data, you are reacting to symptoms rather than understanding causes. With it, you can identify whether your 3pm crash is a glucose rebound, a sleep debt consequence, or a sign of autonomic system overload. Each has a completely different fix.
If you are exploring the broader case for benefits of tracking biomarkers, the argument is consistent: subjective wellbeing scores lag behind biological reality by hours or even days.
How continuous monitoring transforms energy management
A single measurement tells you where you are. Continuous monitoring tells you where you are going and why. This distinction is not subtle. It fundamentally changes what you can do with the information.
What continuous data reveals that snapshots miss:
- Glucose troughs that occur before you consciously feel hungry or fatigued
- Sleep stage disruptions that do not register as poor sleep subjectively but degrade next-day performance
- HRV trends that signal accumulating stress load across a training week before performance drops
- Recovery windows where energy is genuinely replenished versus periods that merely feel adequate
CGM versus finger-stick glucose tests demonstrated this clearly. CGM showed glucose patterns that snapshot tests entirely missed, enabling both behaviour changes and therapy adjustments that improved glycaemic control significantly. The critical insight is that patterns, not points, drive decisions.
How to start building continuous monitoring into your protocol:
- Begin with sleep tracking for two to four weeks before adding other variables. Establish your baseline sleep variability before attempting to optimise it.
- Add glucose monitoring via CGM for a minimum of two weeks to capture your typical dietary and activity patterns.
- Introduce HRV measurement each morning before rising. A consistent measurement context is essential for reliable trend data.
- Review weekly summaries rather than daily readings to avoid overreacting to single-day noise.
- Test one intervention at a time over a minimum of three weeks before assessing its impact on your energy markers.
Pro Tip: Do not fixate on your average glucose or average HRV score. Track variability and time spent in target ranges. A stable glucose profile with high time-in-range is meaningfully better than a slightly lower average with frequent spikes and crashes.
The continuous health monitoring benefits extend beyond awareness into genuine behavioural change. When you see in real time that a particular meal spikes your glucose for three hours, the abstract advice to “eat better” becomes concrete and personal. The personalised metabolic health checklist is a useful starting framework for building this process systematically.
Comparing key energy indicators: glucose, sleep, activity, and HRV
Each energy marker captures a distinct biological dimension. Understanding how they complement each other, and where they diverge, is what separates effective monitoring from noise collection.
| Indicator | What it captures | Timescale | Key metric to track |
|---|---|---|---|
| Blood glucose | Fuel supply and metabolic response | Minutes to hours | Time in target range, glucose variability |
| Sleep quality | Recovery completeness | Hours to days | Night-to-night variability, deep sleep percentage |
| Physical activity | Energy expenditure and conditioning | Days to weeks | Consistency, intensity distribution |
| Heart rate variability | Autonomic resilience and stress load | Days to weeks | Morning HRV trend, weekly average |
Sleep and physical activity are not independent levers. Bidirectional research into sleep and activity using large-scale objective data confirms that good sleep promotes more physical activity, and activity improves sleep quality. These are not parallel tracks. They are a reinforcing loop, and monitoring both simultaneously reveals which direction the loop is running on any given week.
Key observations from integrated monitoring:
- Glucose captures speed. It responds to meals within 30 minutes and normalises within two to three hours. It is your fastest energy feedback signal.
- Sleep captures depth. A single night of poor sleep reduces HRV the following morning. Two consecutive poor nights affect glucose regulation. The cascade is predictable once you are watching it.
- Activity captures conditioning. Low activity this week often predicts poor sleep next week. But over-training without recovery suppresses HRV and amplifies glucose volatility.
- HRV captures integration. It is the one marker that synthesises signals from all other systems into a single autonomic score.
Pro Tip: When you are unsure which energy lever to prioritise, look at your HRV trend first. If it is declining across multiple days, recovery is the intervention, not more activity, not dietary restriction, not additional monitoring. Rest and sleep quality should take precedence.
Reviewing metabolism testing examples helps contextualise where laboratory assessments complement wearable data, and assessing metabolic markers for recovery shows how to apply these in a structured recovery context.
Personalising energy monitoring for better health and performance
The energy monitoring for health conversation tends to stall at “track more things.” The more important question is what you do with the data once you have it. Personalisation is not about having the most data. It is about identifying which signals respond to which interventions for your specific biology.
Building a personalised energy monitoring protocol:
- Identify your primary energy complaint. Is it morning fatigue, post-meal crashes, afternoon slumps, or poor recovery after training? This determines which biomarker to prioritise first.
- Establish a two-week baseline with no intentional interventions. Understand your current state before changing anything.
- Test interventions in isolation. Change one dietary variable, sleep timing adjustment, or training modification, then observe its impact on your target metric for three to four weeks.
- Use time-in-range and variability metrics as your primary feedback, not averages.
- Reassess your protocol monthly. Biology adapts, and what worked at month one may need adjustment by month three.
Clinical improvements in glycaemic control consistently emerge from tracking metrics like time-in-range and night-to-night sleep variability rather than single measurements. This is not a nuance for specialists. It is the foundation of how energy level management tips translate into actual results.
Useful applications include:
- Adjusting meal composition and timing based on personal glucose response data rather than generic dietary guidelines
- Modifying training load based on HRV trend, preventing accumulated fatigue before performance suffers
- Optimising sleep timing and environment based on observed sleep variability, not just sleep duration
- Stress management prioritisation triggered by sustained HRV suppression that precedes conscious feelings of overload
The metabolic health improvement workflow maps out how to sequence these interventions practically. Understanding the power of metabolic health data makes the case for why this level of specificity produces outcomes that generic advice cannot.
Enhancing energy monitoring with advanced biofeedback techniques
Passive monitoring tells you the state of your system. Active biofeedback training changes it. Heart rate variability biofeedback (HRV-B) is the most evidence-grounded tool for deliberately improving autonomic system function, which directly underpins both physical and mental energy.
HRV biofeedback works by training you to breathe at your resonance frequency, typically around 6 breaths per minute for most adults, which maximises the amplitude of HRV oscillations and strengthens vagal tone over time. This is not meditation. It is a structured physiological training protocol.
Key findings and practical guidance:
- HRV biofeedback improves depression symptoms and measurably increases HRV, with the strongest outcomes linked to maximising resonance frequency and keeping sessions under 20 minutes per day.
- Short, consistent daily sessions outperform long, infrequent ones. Fifteen minutes daily beats 90 minutes twice weekly.
- Device interface quality and real-time feedback accuracy matter. Poor equipment produces inconsistent resonance results.
- HRV-B complements passive monitoring by closing the loop between measurement and intervention. You are not just observing your autonomic state. You are training it.
The impact of energy on productivity is rarely discussed at the autonomic level, yet this is where sustained mental performance lives. Stable HRV supports faster cognitive recovery after stress, better emotional regulation, and clearer decision-making. These are not peripheral benefits.
Pro Tip: Combine HRV biofeedback sessions with morning HRV tracking to confirm that your protocol is producing measurable autonomic improvement over four to six weeks. If your resting HRV is not trending upward within that window, revisit your resonance frequency or session consistency.
See how health optimisation via biological data applies these principles in integrated protocols.
A fresh perspective: why monitoring energy as a dynamic system is the future
Here is what most energy-tracking content gets wrong. It treats energy as a single dial that moves up or down in response to obvious inputs like sleep or meals. The reality is that energy is a dynamic system output that operates on at least three distinct timescales simultaneously: fast (minutes to hours, driven by glucose and acute stress), medium (days, driven by sleep quality and HRV), and slow (weeks, driven by training adaptation, hormonal rhythms, and recovery capacity).
When you collapse these timescales into a single daily score, you lose the most actionable information. You see the average, not the architecture. And the architecture is where the leverage is.
Energy as a multi-timescale system signal means that interventions must be tested on appropriately matched timescales. A dietary change should be evaluated on its glucose impact within days. The same change should be evaluated on its effect on HRV trend and sleep variability over weeks. Most people abandon interventions before the slower signals have had time to respond.
The second common failure is monitoring without protocol. Collecting HRV data for six months without a structured response framework produces nothing actionable. Data without decision rules is just noise with extra steps.
The case for why tracking biomarkers matters is strongest when the monitoring is embedded within a deliberate protocol. Not just what to track, but what actions follow specific patterns, what thresholds trigger intervention reviews, and what timescales govern each assessment.
The individuals who extract genuine performance gains from energy monitoring are not those with the most sophisticated devices. They are those who have matched their monitoring cadence to the biological timescale of the signal they are trying to influence.
Enhance your energy journey with AI Healthician’s personalised testing solutions
Understanding why track energy fluctuations is the first step. Acting on that understanding with precise, personalised testing is what drives real change.

AI Healthician combines functional testing with data-driven protocol design to give you a complete biological picture of your energy systems. From DNA health testing that reveals your genetic predispositions for metabolic efficiency and recovery, to resting and active metabolic assessments paired with 3D body composition scanning, every test is designed to generate actionable intelligence rather than abstract data. If you want to understand exactly where your energy is being lost and which interventions your biology will actually respond to, the active metabolic test is a direct starting point. This is not general wellness. It is targeted, measurable, and built around your physiology.
Frequently asked questions
Why is monitoring energy levels more effective than relying on how I feel?
Subjective energy feelings typically lag behind biological changes by several hours, meaning you react to problems rather than preventing them. CGM glucose pattern data shows that objective monitoring identifies the causes of energy swings that feelings alone cannot pinpoint.
How often should I track my energy-related biomarkers for best results?
You need data at both hourly and weekly resolutions because energy operates on multiple timescales. Interventions tested over weeks capture recovery and adaptation signals that single-day data obscures entirely.
Can heart rate variability biofeedback really improve my energy and mental health?
Yes. HRV biofeedback reduces depressive symptoms and measurably increases HRV, particularly when sessions are kept under 20 minutes daily with maximised resonance frequency, improving both physical and mental energy.
Is it better to focus on improving sleep or physical activity to boost energy?
Both are interlinked, but sleep effects on next-day activity are stronger than the reverse, making sleep quality the higher-leverage starting point for most people seeking sustained energy improvements.
What metrics from glucose monitoring should I focus on for energy optimisation?
Prioritise time-in-target glucose range and glucose variability over your average reading. CGM time-in-range metrics are clinically more meaningful for energy stability than average glucose figures from standard blood tests.


